PEOPLE. ROBOTS. SOFTWARE.
See how systems work.
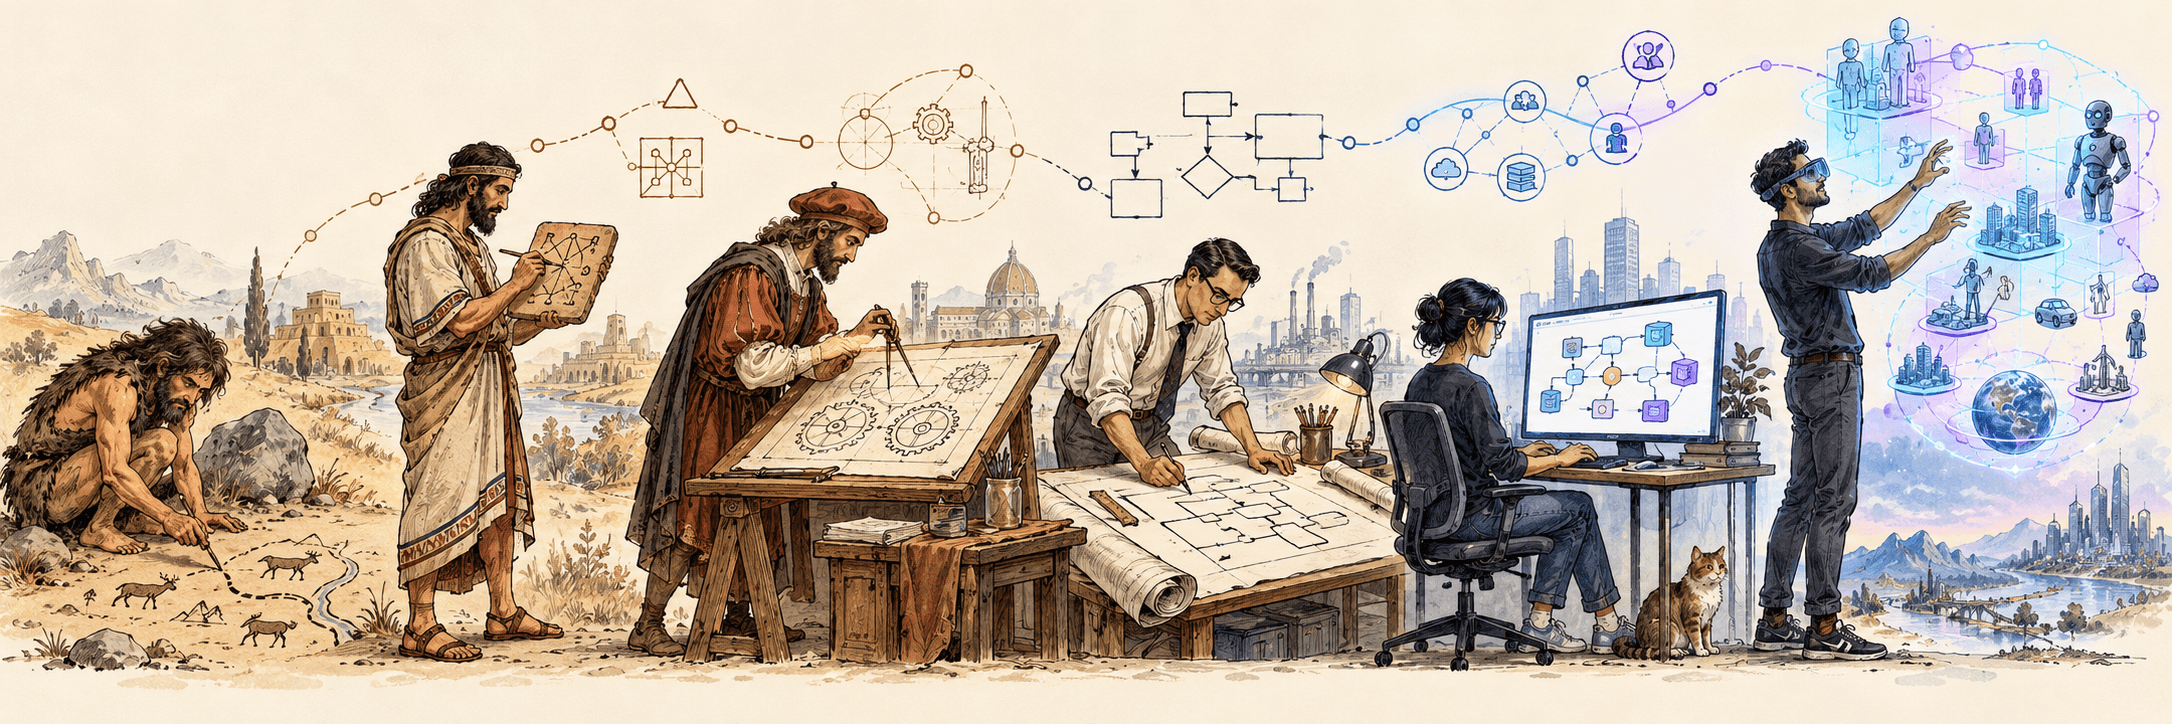
We build increasingly complex systems. Visualization helps people understand, navigate, and operate them. Explore the tools connecting human networks, robotics, and software—from system maps to 3D and VR.
Explore the directoryTHE DIRECTORY + THE NEWSLETTER
67
curated tools
03
connected disciplines
Primary sources
linked in every listing
Oct 17, 2026
last research review
EXPLORE THE DIRECTORY
Choose a lens for your system.
Start with a discipline or workflow. Each card opens the directory with its matching tab selected; switch tabs any time to explore the connections. AI assisted and Open source filters work across every category.
All tools
Explore the complete directory across human networks, robotics, and software. Compare approaches and find the right fit for your system.
Human systems
Map people, organizations, relationships, and feedback loops. Make the connections behind complex social and organizational systems visible.
Robotics
Inspect robot behavior, perception, and telemetry. Connect synchronized 3D views, sensors, maps, and recorded events.
Software systems
Visualize software architecture, service interactions, data models, and dependencies. Keep teams aligned as systems evolve.
Modeling infrastructure
Discover graph databases and query infrastructure that support connected models and visualization workflows. Build a foundation for custom system views.
Digital twins
Connect physical assets and processes to digital models. Explore tools for inspecting live state, dependencies, and simulated scenarios.
Spatial & immersive
Explore spatial data and systems in 3D, VR, and AR. Check each listing for its supported displays and interaction capabilities.
Knowledge graphs
Explore entities, relationships, and connected knowledge. Navigate semantic models and dependencies across domains.
Your workspace for understanding complex systems.
Search the full tool directory, filter by discipline, save a watchlist, and compare the tools that fit your work. Follow the newsletter for developments in cross-domain, spatial, and multiscale visualization.
SIGNAL OVER NOISE
“Best” depends on what you’re building.
We prioritize clear representations, useful workflows, inspectable outputs, and documented capabilities. Open-source listings identify repositories and license editions. Picks reflect documented features, not hands-on benchmarks or paid placements.
The watchlist stays in this browser. Weekly research runs Tuesdays at 11:00 AM Pacific, following cross-domain systems, 3D, VR, holographic displays, traversable environments, and multiscale visualization.